UnifiedMetrics

一个功能齐全的 Minecraft 服务器指标收集代理。支持 Prometheus 和 InfluxDB。

资源图片
![UnifiedMetrics](https://raw.githubusercontent.com/Cubxity/UnifiedMetrics/dev/0.3.x/.github/assets/banner.png) [![License](https://img.shields.io/github/license/Cubxity/UnifiedMetrics?style=flat-square)](COPYING.LESSER) [![Issues](https://img.shields.io/github/issues/Cubxity/UnifiedMetrics?style=flat-square)](https://github.com/Cubxity/UnifiedMetrics/issues) [![Workflow Status](https://img.shields.io/github/workflow/status/Cubxity/UnifiedMetrics/gradle-preview-ci/master?style=flat-square)](https://github.com/Cubxity/UnifiedMetrics/actions) [![Discord](https://img.shields.io/badge/join-discord-blue?style=flat-square)](https://discord.gg/kDDhqJmPpA) UnifiedMetrics 是一个完全具备功能的免费且开源的 Minecraft 服务器指标收集插件。 此项目 使用 [GNU LGPLv3](COPYING.LESSER) 许可。 [![Grafana Dashboard](https://raw.githubusercontent.com/Cubxity/UnifiedMetrics/dev/0.3.x/.github/assets/grafana.png)](https://dedimc.link/unifiedmetrics) *
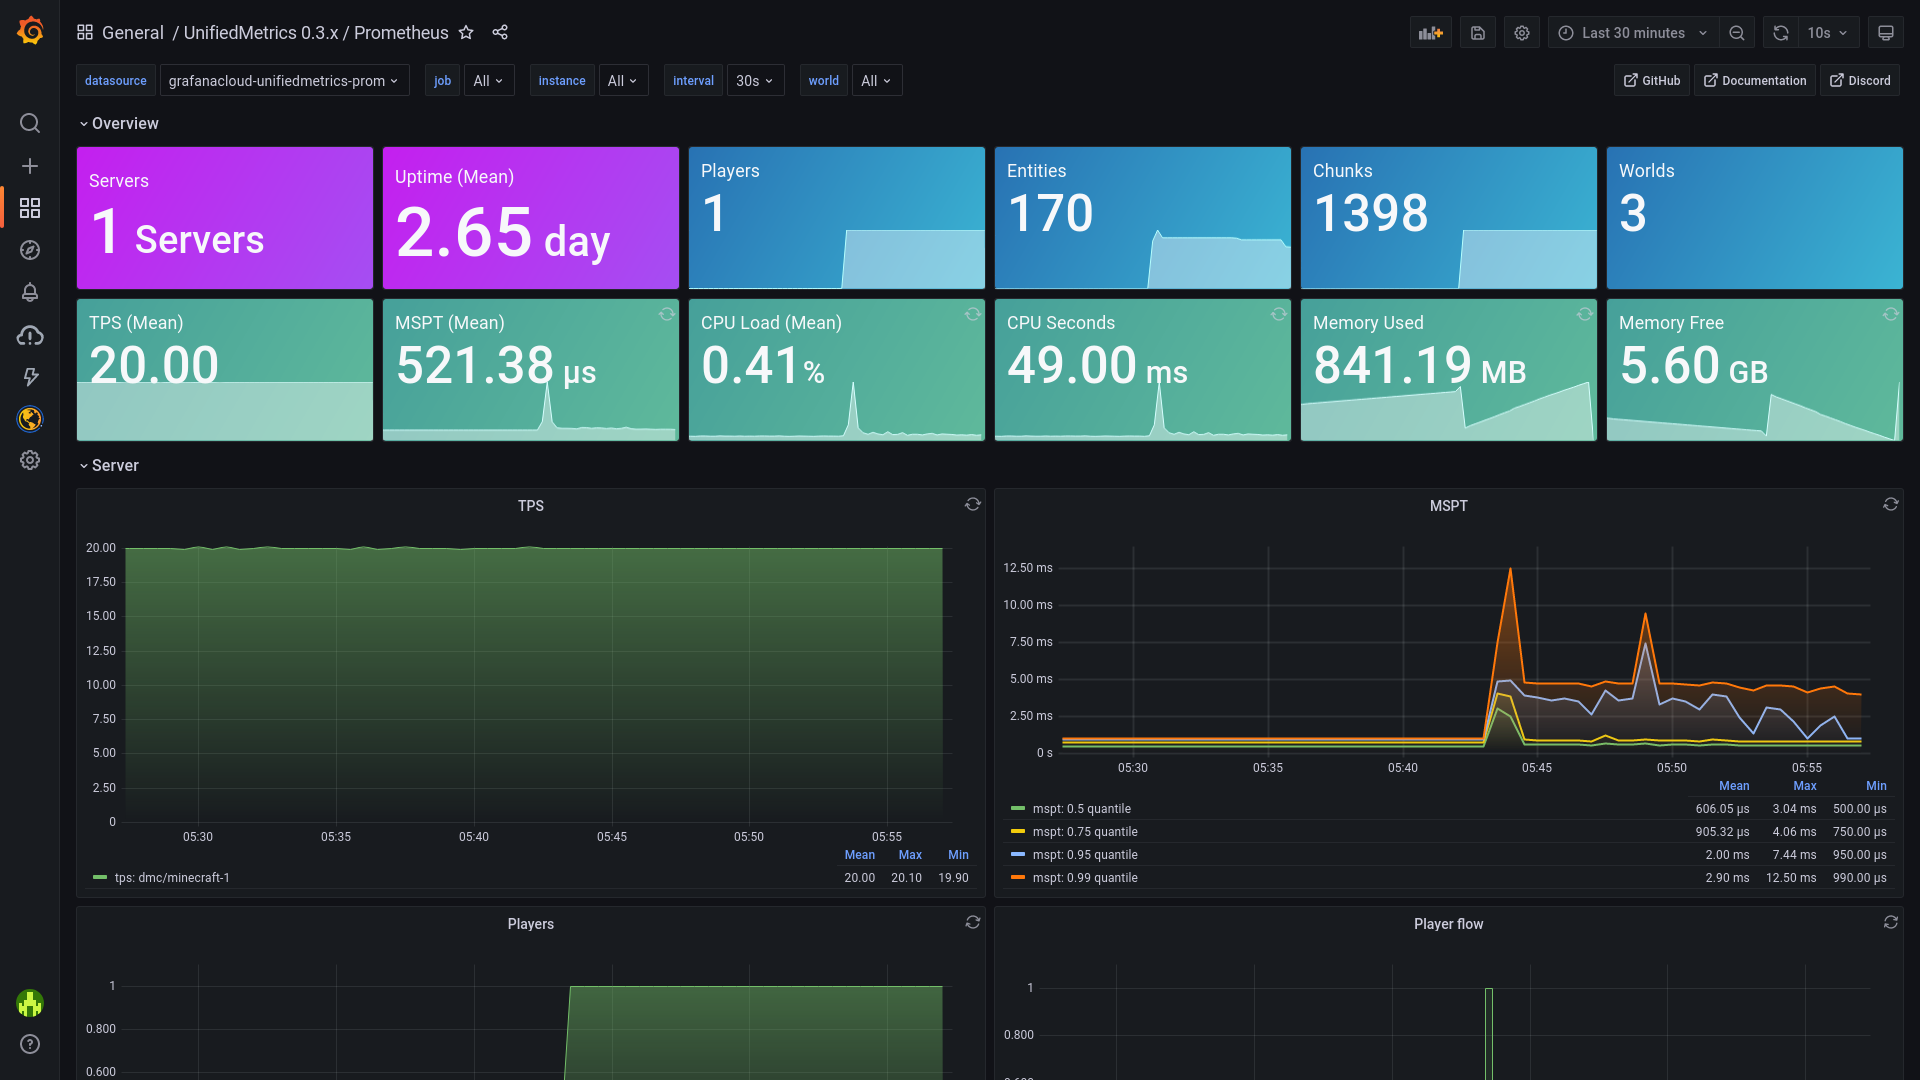
Dashboard [包含](https://github.com/Cubxity/UnifiedMetrics/wiki/Grafana) 在开箱即用的环境中!* [点击这里](https://unifiedmetrics-demo.cubxity.dev/) 查看实时预览! ## 特性 - **平台无关 & 与流行的平台兼容**。 获得任何支持的平台上相同的指标和功能。 - **使用 Prometheus/InfluxDB 和提供的 Grafana 仪表板实时监控你的服务器**。 - **高性能** 指标收集。 几乎对服务器性能没有影响。 - **免费且开源**。 代码对任何人来说都是免费和开放的,可以进行审计和贡献。 ## 兼容性 **服务器:** - 1.8+ Spigot 服务器 *(包括基于 Spigot 的分支)* - 1.16+ Fabric 服务器 - Minestom - Velocity - BungeeCord **指标:** - Prometheus - InfluxDB ## 快速开始 阅读 [wiki](https://github.com/Cubxity/UnifiedMetrics/wiki) 了解如何开始的说明。 ## 指标
指标表 (点击显示) | Collector | 描述 | Platform | Default | | ------------- | ----------------------------------------------- | ------------------- | ------- | | systemGc | 垃圾回收持续时间和释放的字节 | All | true | | systemMemory | 使用的、已提交的、最大和初始内存 | All | true | | systemProcess | CPU 负载、秒数和进程启动时间 | All | true | | systemThread | 当前、守护线程、启动线程和峰值线程数 | All | true | | events | 登录、加入、退出、聊天和 ping 事件计数 | All | true | | server | 插件数量和玩家数量 | All | true | | tick | Tick 持续时间直方图 | Bukkit, Minestom | true | | world | 世界实体、玩家和区块数量 | Bukkit, Minestom | true |
## 特别感谢 [Bloom Host](https://billing.bloom.host/aff.php?aff=9) 慷慨地为 UnifiedMetrics 提供了开发服务器。 Bloom 内置了服务器分割功能,使构建监控堆栈变得非常容易。 通过使用 [此链接](https://billing.bloom.host/aff.php?aff=9) 在 Bloom 上获取高性能 服务器。 [![Bloom logo](https://bloom.host/banner.gif)](https://billing.bloom.host/aff.php?aff=9) YourKit 凭借其创新和智能工具,支持开源项目监控和分析 Java 和 .NET 应用程序。 YourKit 是 [YourKit Java Profiler](https://www.yourkit.com/java/profiler/)、 [YourKit .NET Profiler](https://www.yourkit.com/.net/profiler/) 和 [YourKit YouMonitor](https://www.yourkit.com/youmonitor/) 的创建者。 [![YourKit Logo](https://www.yourkit.com/images/yklogo.png)](https://www.yourkit.com/) ## 从源代码构建
说明 (点击显示) **要求:** - JDK 8+ (Fabric 为 16+,Minestom 为 17+) - Git (可选) 要构建 UnifiedMetrics,你需要先获取源代码。 你可以从 GitHub 下载源代码或使用 Git CLI。 ```bash $ git clone https://github.com/Cubxity/UnifiedMetrics && cd UnifiedMetrics ``` 在克隆目录中打开终端并运行以下命令。 以下命令将构建所有子项目。 ```bash $ ./gradlew assemble -x signArchives ``` > `-x signArchives` 用于跳过签名,除非你设置了签名 要构建特定的子项目,你可以前缀它加上子项目路径。 例如: ```bash $ ./gradlew :unifiedmetrics-platform-bukkit:assemble -x signArchives ``` 输出工件可以在 `subproject/build/libs` 中找到。
## API
说明 (点击显示) ### 示例 示例插件可以在 [examples](examples) 目录中找到。 ### Gradle (Kotlin) ```kotlin repositories { mavenCentral() maven("https://s01.oss.sonatype.org/content/repositories/snapshots/") } ``` ```kotlin dependencies { // ... compileOnly("dev.cubxity.plugins", "unifiedmetrics-api", "0.3.3-SNAPSHOT") } ``` ### 用法 将 `:unifiedmetrics-api` 作为依赖项添加(compileOnly/provided)。 如果可能,请使用平台的服务管理器。 ```kotlin import dev.cubxity.plugins.metrics.api.UnifiedMetricsProvider /* ... */ val api = UnifiedMetricsProvider.get() ```